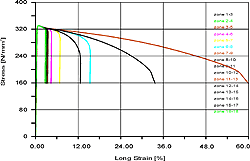
The varying strain behavior of the different areas at the specimen can be seen in the locally resolved stress-strain diagram above.
|
Stress-Strain-Diagram with Characteristic Values 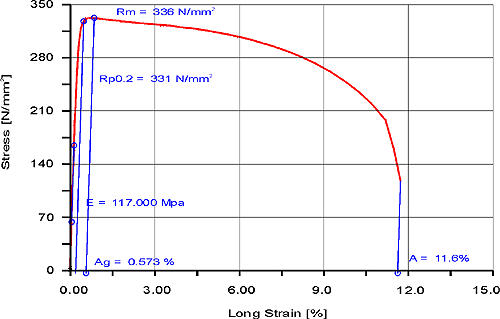
The varying strain behavior of the different areas at the specimen can be seen in the locally resolved stress-strain diagram above. 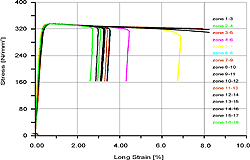
The diagram scaled to 10 % shows that in the zones outside the rupture area the strain is decreasing by the elastic range after necking occurs. 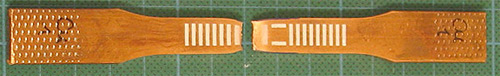
Specimen after Tensile Test |