|

Strain Distribution along the Specimen
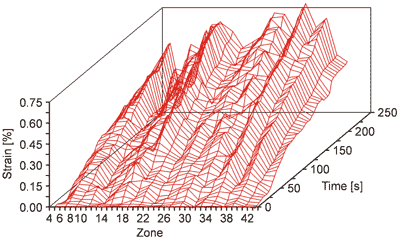
This diagram shows the strain distribution along the specimen over time.
The left area of the specimen showed somewhat smaller
strain values than the right area. The rightmost zone however, shows
significantly lower strein than the surrounding parts. Detailed examination of
the specimen showed, that in addition to the non-uniform structure of wood. the
cross section was not homogeneous along the observation length.
|
