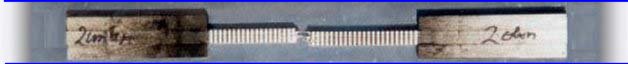
Strain Measurement at Wood
|
Stress-Strain Diagram and Derivative (Modulus)
Throughout the experiment, time, load and strain were recorded. The data evaluation software automatically calculates stress from load and the initial cross selection. This diagram shows the stress-strain diagram (red) and its derivative (blue). The blue curve is the Modulus determined by applying a linear regression calculation to the stress-strain-curve. |